import numpy as np
import math
import matplotlib.pyplot as pltBasic Metropolis-Hastings
Base chain
Consider a Markov Chain that moves left/right with equal probability:
def base_chain(current_state):
    move = np.random.choice([-1,1])
    return current_state + move

current = 0
for t in range(20):
    print(current, end=" -> ")
    current = base_chain(current)
0 -> -1 -> -2 -> -1 -> 0 -> 1 -> 0 -> -1 -> 0 -> -1 -> -2 -> -3 -> -4 -> -5 -> -6 -> -5 -> -4 -> -5 -> -6 -> -7 -> Target stationary distribution
We now wish to construct another chain with stationary distribution given by the following mixture
from scipy.stats import poisson

def mixture(n):
    return 0.25 * poisson.pmf(n, mu=3.0, loc=0) \
            + 0.25 * poisson.pmf(n, mu=12.0, loc=0) \
            + 0.5 * poisson.pmf(n, mu=25, loc=0)

plt.plot([n for n in range(0, 40)],
         [mixture(n) for n in range(0, 40)], c='red', label='pi')
plt.legend()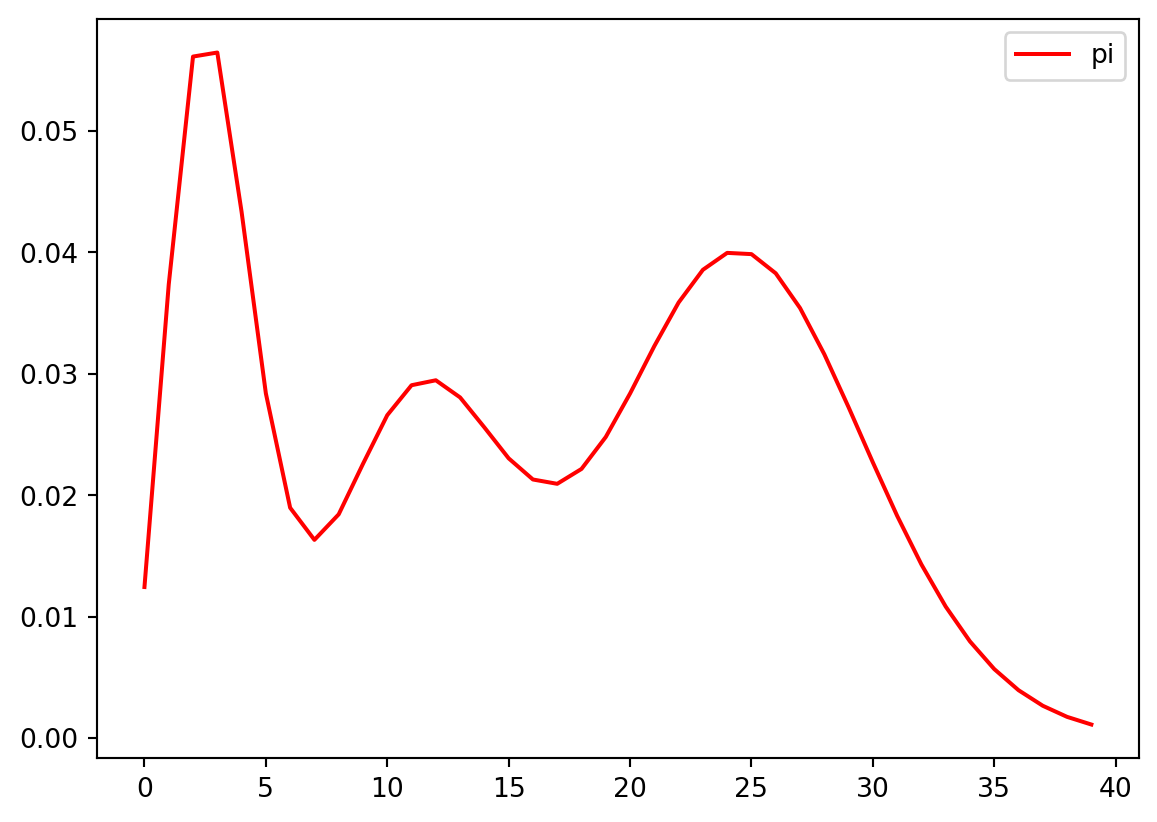
Metropolis-Hastings, acceptance probability
Since the base chain is symmetric (with transitions \(\psi(x,x\pm1)=1/2\)), the Metropolis scheme is defined as follows:
Given \(x_t\),
- Sample \(y_{t+1}\) according to \(\psi(x_t, \cdot)\),
- Either
- Accept the move (\(x_{t+1}=y_{t+1}\)) with probability \(a(x_t,y_t)=\min\{1, \pi(x)/\pi(y) \},\)
or
- Reject the move \((x_{t+1}=x_t\)) with probability \(1-a(x_t,y_{t+1})\).
- Accept the move (\(x_{t+1}=y_{t+1}\)) with probability \(a(x_t,y_t)=\min\{1, \pi(x)/\pi(y) \},\)
current = 0
states_visited = []
for t in range(100000):
proposal = base_chain(current)
U = np.random.uniform()
a = mixture(proposal) / mixture(current)
current = proposal if U <= a else current
states_visited.append(current)
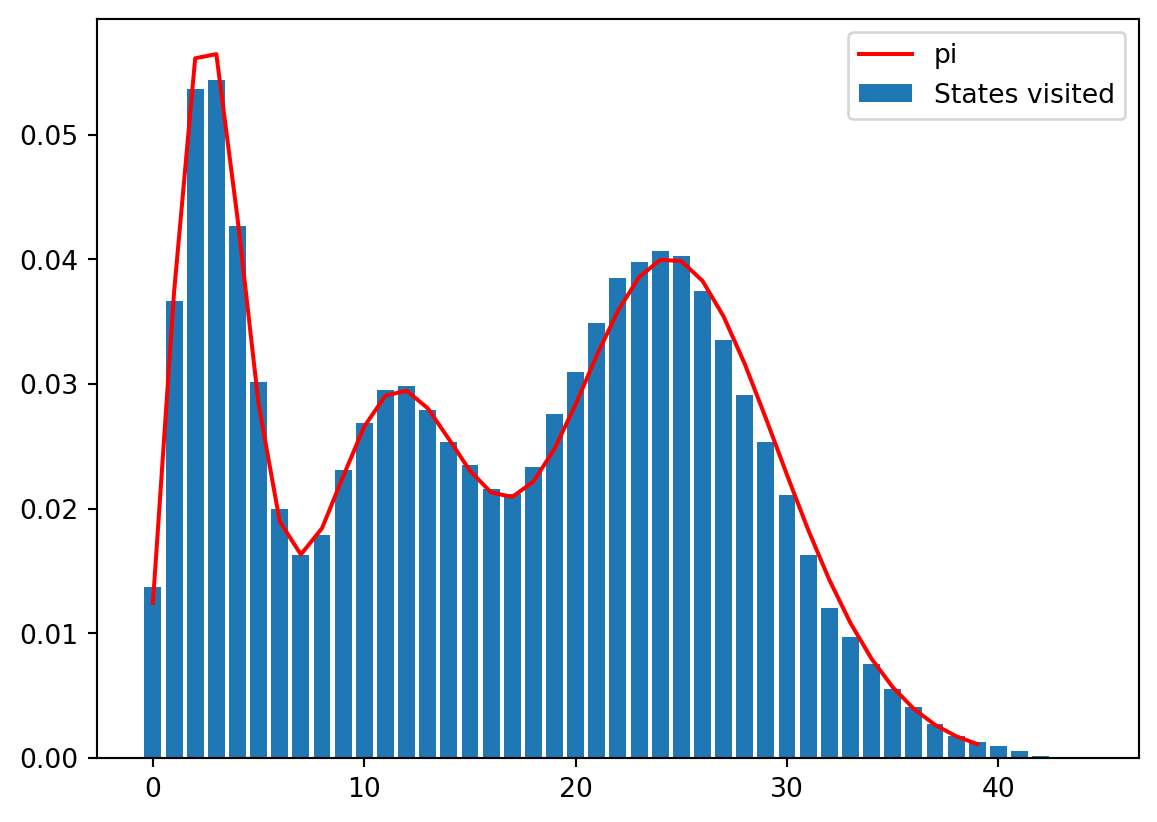
# Counting states visited by the metropolis chain
states, counts = np.unique(states_visited, return_counts=True)
plt.bar(states, counts/len(states_visited), label='States visited')
# theoretical target distribution
plt.plot([n for n in range(0, 40)],
[mixture(n) for n in range(0, 40)], c='red', label='pi')
plt.legend()